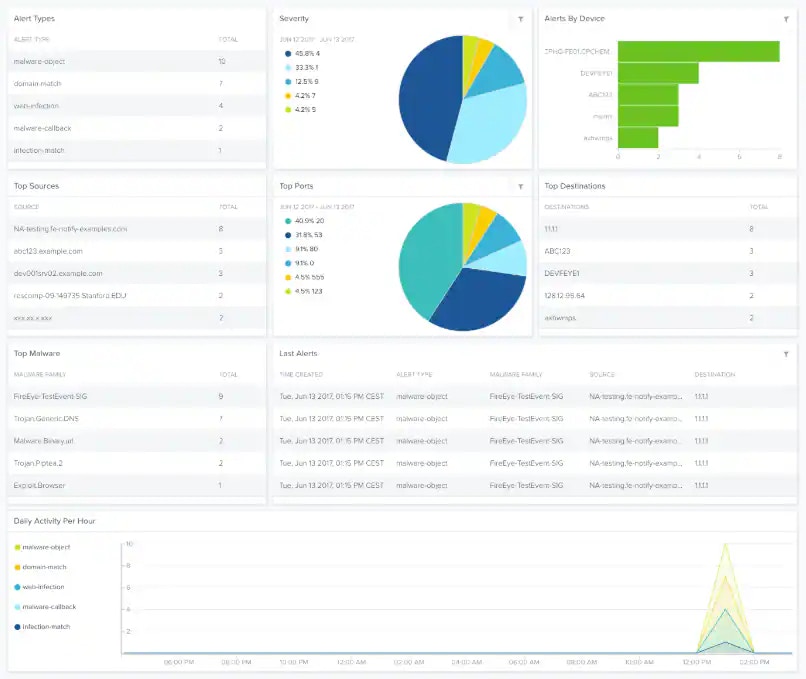
Depending on the USM Anywhere Sensor you have installed, the widgets might be visible in the FireEye dashboard. This dashboard displays data when the Reporting Device Vendor field has the FireEye value .
Widgets in the FireEye Dashboard
Widget
Description
Alert Types
List of alerts by type.
Severity
Pie chart displaying, in percentages, the detected severity.
Alerts by Device
Total number of alerts by device.
Top Sources
List of the top sources.
Top Ports
Pie chart displaying, in percentages, the top ports.
Top Destinations
List of the top destinations.
Top Malware
List of the top malware.
Last Alerts
List of the last-detected alerts.
Daily Activity Per Hour
Graph that displays the daily activity per hour.
Assistant
Responses are generated using AI and may contain mistakes.