| Role Availability | Read-Only | Investigator | Analyst | Manager |
| Field | Description |
|---|---|
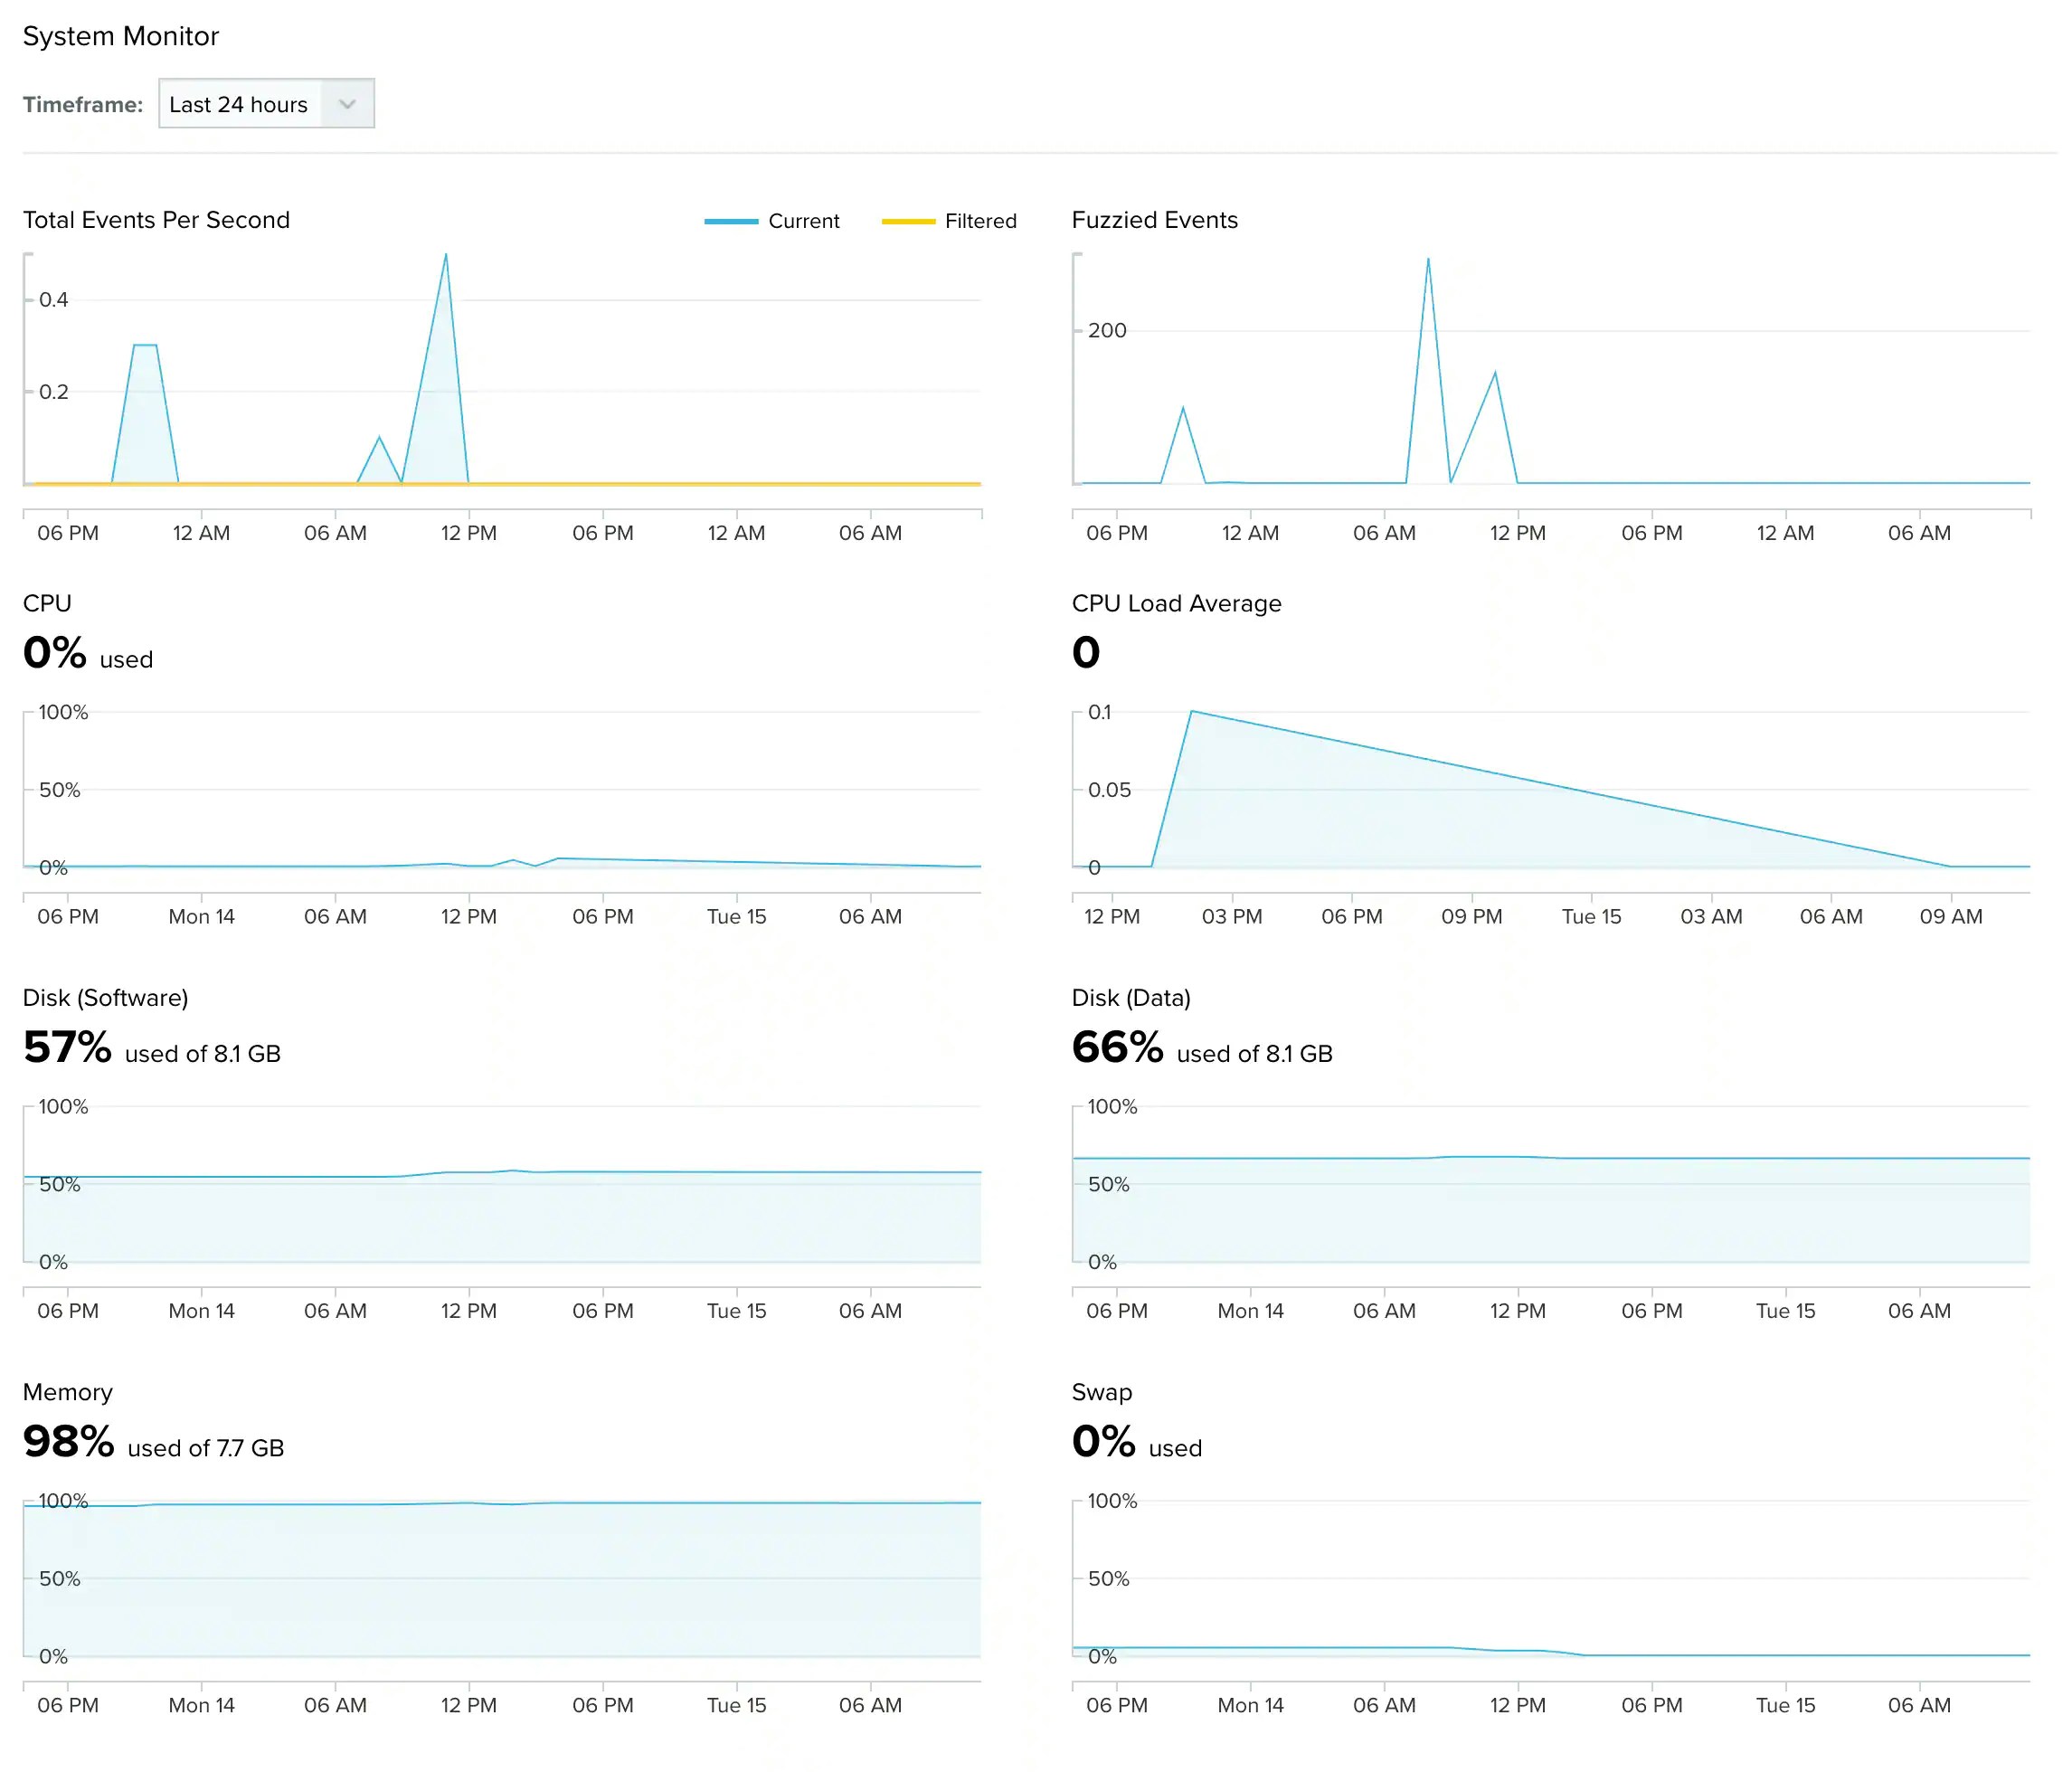
| Total Events Per Second | Graph displaying the total events received per second. (You can see the current and the filtered events.) |
| Fuzzied Events | Graph displaying the total fuzzied events received per second. See About the Was Fuzzied Filter for more information. |
| CPU | Graph displaying in percentages the total CPU used. |
| CPU Load Average | Graph displaying the load average of the CPU. |
| Disk (Software) | Graph displaying in percentages the total disk (software) used. |
| Disk (Data) | Graph displaying in percentages the total disk (data) used. |
| Memory | Graph displaying in percentages the total memory used. |
| Swap | Graph displaying in percentages the total swap used. |