| Column Field Name | Description |
|---|---|
| Last Seen | Last date on which the configuration issue was seen in the asset. The displayed date depends on your computer’s time zone |
| Category | Category of the configuration issue. Issues with similar impacts have the same category |
| Subcategory | Sub-category of the configuration issue. The sub-category explains the detail of the issue |
| Asset | Asset associated with the configuration issue |
| Severity | Severity of the issue (values are Low, Medium, or High) |
| Description | Text for identifying the configuration issue |
| First Seen | Date of detection of the configuration issue in the asset (the displayed date depends on your computer’s time zone) |
- Add to Current Filter: Use this option to add the asset name as a search filter. See Searching Events for more information.
- Find in Events: Use this option to execute a search of the asset name in the Events page. See Searching Events for more information.
- Look up in OTX: This option searches the IP address of the asset in the OTX page. See Using OTX in USM Anywhere for more information.
- Full Details: See Viewing Assets Details for more information.
- Configure Asset: See Editing Assets for more information.
- Delete Asset: See Deleting the Assets for more information.
- Assign Credentials: See Managing Credentials in USM Anywhere for more information.
- Authenticated Scan: This option displays depending on the USM Anywhere Sensor associated with the asset. See Running Authenticated Asset Scans for more information.
- Scan with BlueApp: This option enables you to run an asset scan through an BlueApp. See Running Asset Scans Using a BlueApp for more information.
- Configuration Issues: This option opens the Assets Details page. The Configuration Issues tab is selected in the page. See Viewing Assets Details for more information.
- Vulnerabilities: This option opens the Assets Details page. The Vulnerabilities tab is selected in the page. See Viewing Assets Details for more information.
- Alarms: This option opens the Assets Details page. The Alarms tab is selected in the page. See Viewing Assets Details for more information.
- : This option opens the Assets Details page. The Events tab is selected in the page. See Viewing Assets Details for more information.
You can view your bookmarked items by going to the secondary menu and clicking the  icon. This will display all of your bookmarked items and provide direct links to each of them.
Views
USM Anywhere enables you to define and save a custom Configuration Issues view to have your own selected filters. You can configure the view you want for the list of items in the page. To create a view configuration- From the list view, select the filters you want to apply.
-
Go to Save View > Save As.
The Save Current View dialog box opens.
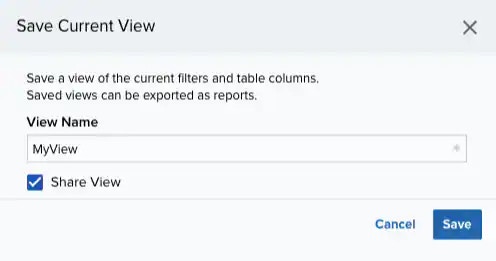
- Enter a name for the view.
- (Optional.) Select Share View if you want to share your view with other users.
- Click Save. The created view is already selected.
- From the ist view, click View above the filters.
-
Click Saved Views, and then select the view you want to see.
A shared view includes the
 icon next to its name.
 - Click Apply.
- From the Configuration Issues list view, click View above the filters.
-
Click Saved Views, and then click the
 icon next to the saved view you want to delete.
A Settings Delete dialog box opens to confirm the deletion.
icon next to the saved view you want to delete.
A Settings Delete dialog box opens to confirm the deletion.
-
Click Accept.
The icon does not display if the view is selected.
You can only delete the views you have created.
Configuration Issues from the Assets Main Page
To explore configuration issues from assets- Go to Environment > Configuration Issues.
- Filter assets by clicking Has Configuration Issues. See Searching Assets for more information.
- Click the
 icon and select Configuration Issues. The asset details page opens with the list of configuration issues.