| | | | |
|---|
| Role Availability | Read-Only | Investigator | Analyst | Manager |
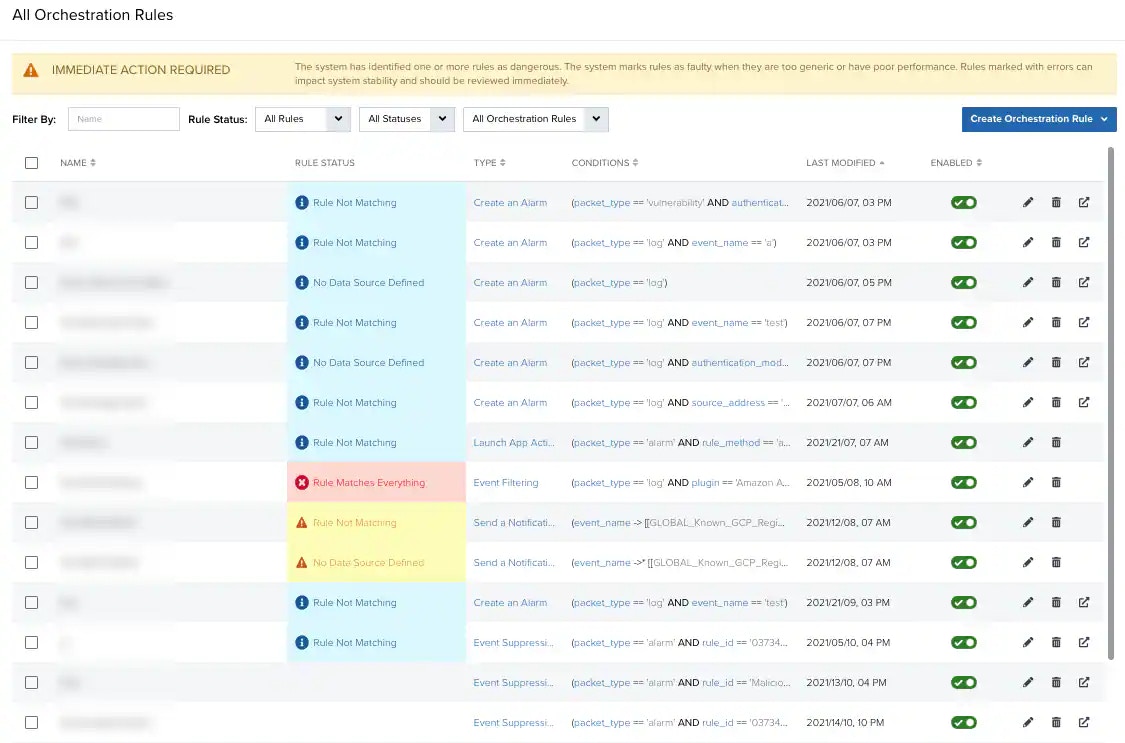
- At the top of the page, you can see a banner if there is at least one rule that has errors. This yellow banner is recommended for reviewing and fixing rules with any error. Errors can impact system stability and must be reviewed immediately.
- Below the banner, you can see the filters that you can apply. You can filter by name, by rule status, and by orchestration rule.
- The main part of the page is the list of rules, where each row describes an individual rule. You can enable, disable, edit, and delete a rule. You can also choose a rule by selecting the checkbox to the left of the rule. Select all rules at the same time by selecting the first checkbox in the column. Enable (
 ) and disable (
 ) rules by using the buttons below the enabled column. You can also see the details of a rule by clicking it. The
  icon is available for the Event Suppression and Create an Alarm rows.
The following table lists the columns you see on the page.
Columns on the All Orchestration Rules page
| Column | Description |
|---|
| Name | Name of the rule. |
| Rule Status | Status notification of the rule. Each rule is classified by its severity. Values are (in increasing severity): info, warning, and error. |
| Type | Type of rule. |
| Conditions | Conditions applied by the rule. |
| Last Modified | Date and time on which that rule has been modified. |
| Triggered | Column displays when you apply an all orchestration rules filter. If you have filtered by Alarm rules, the number below the column indicates the times that rule has triggered an alarm. If you have filtered by any other rule, the number indicates the hits value, how often a rule has matched its criteria against an event. |
| Enabled | Icons to enable or disable the rule. |
  | Icons to edit or delete the rule. |
| Icon available for the Event Suppression and Create an Alarm rows. Depending on the selected option, the Events List View page or the Alarms List View page opens. |
Orchestration Rules Details
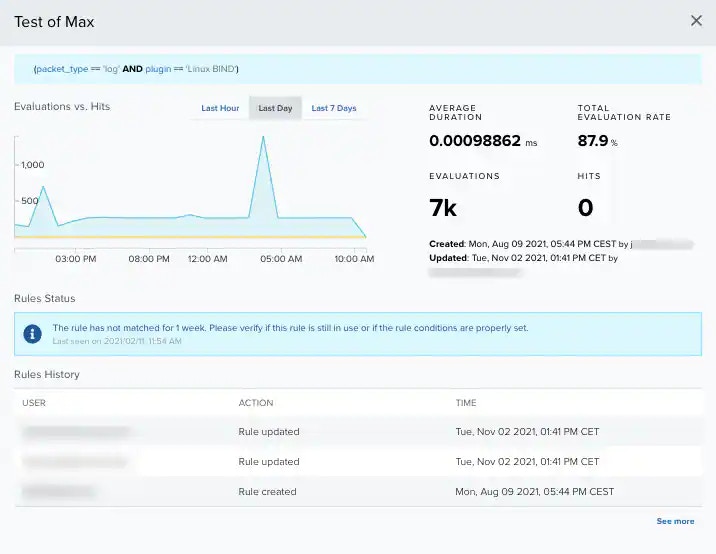
USM Anywhere provides visibility on how your rules behave. Click any rule on the All Orchestration Rules page to display the details.
Note: The default time range for the trend chart is 24 hours. You can click Last Hour, Last Day, or Last 7 Days to change the time range.
-
Evaluations vs. Hits: This graph shows the progress of the rule triggers over the last 7 days, 24 hours, or 1 hour.
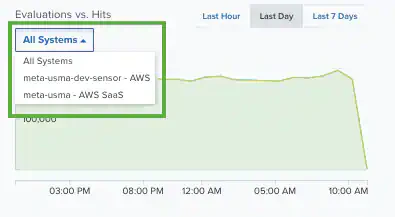
-
All Systems: This combo box displays when you have expanded a filtering rule. Choose between the control node or the sensor. Choose the All Systems option if you want to display the data of both control node and sensor.
-
Average Duration: Average time it takes (in milliseconds) to evaluate the rule.
-
Evaluations: How many times a rule has been evaluated.
-
Alarms Triggered: How many times the rule has executed the associated action. This number might be different than Hits if the rule has a mute period assigned.
Important: This field only displays when you have expanded an alarm rule.
Orchestration Rules Management
USM Anywhere enables you to manage your own orchestration rules from the All Orchestration Rules page.
To filter orchestration rules by name
- Go to Settings > Rules.
- Click the box next to Filter By.
- Enter your search.
To filter orchestration rules by rule status
- Go to Settings > Rules.
- Click the combo box next to Rule Status.
- Select All Rules, Enabled, or Disabled.
To edit an orchestration rule
- Go to Settings > Rules.
- Click the icon of the rule you want to edit.
- Modify the data of the items that need to be modified.
- Click Next.
- Click Save.
To delete an orchestration rule
- Go to Settings > Rules.
- Click the icon of the rule you want to delete.
- Confirm by clicking Accept.
To enable an orchestration rule
- Go to Settings > Rules.
- Click the icon of the rule you want to enable.
To disable an orchestration rule
- Go to Settings > Rules.
- Click the icon of the rule you want to disable.
To enable all orchestration rules
- Go to Settings > Rules.
- In the list of rules, select the first checkbox in the first column to select all the rules.
- Click Enable All Rules.
To disable all suppression rules
- Go to Settings > Rules.
- In the list of rules, select the first checkbox in the first column to select all the rules.
- Click Disable All Rules.
- Confirm by clicking Accept.
To show triggered alarms rules or suppressed events
-
Go to Settings > Rules to open the All Orchestration Rules page.
-
In the row, click the icon.
This icon is available for the Event Suppression and Create an Alarm rows.
Depending on the selected option, the Events List View page or the Alarms List View page opens. The page includes Rules Name as a filter so that you can see how many alarms or events match the selected rule.