Changing the Date Range
You can select the timeframe from which the data is being displayed. The default time frame is Current.The larger the time range, the longer it will take for the data to be displayed.
- Click the Current dropdown. The Time Range options are displayed.

- Select the checkbox of the timeframe you prefer. You may also select the Custom checkbox to specify a specific date and time range.
 Click the blue calendar icon to open the calendar widget and select a date.
 - Click Apply.
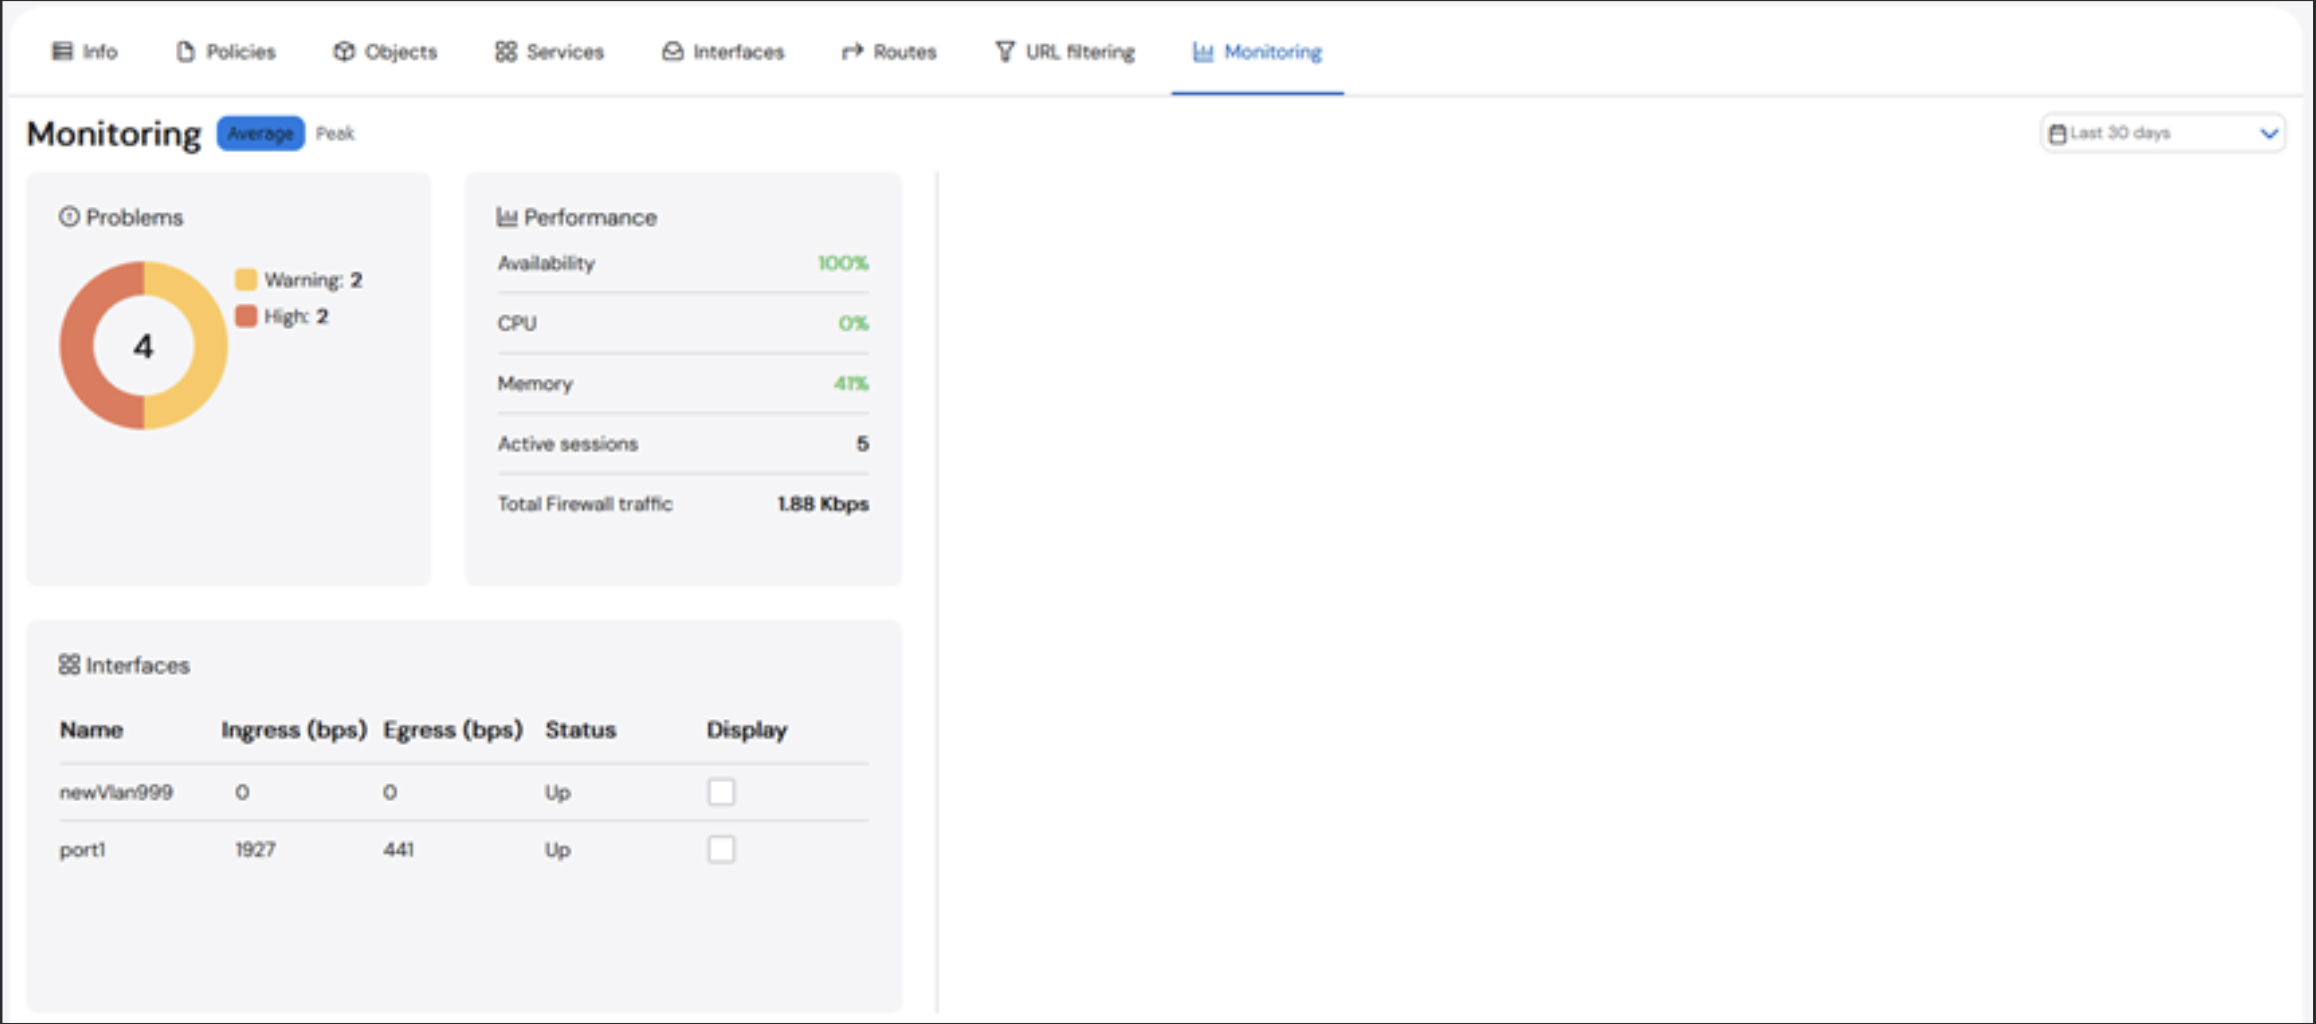
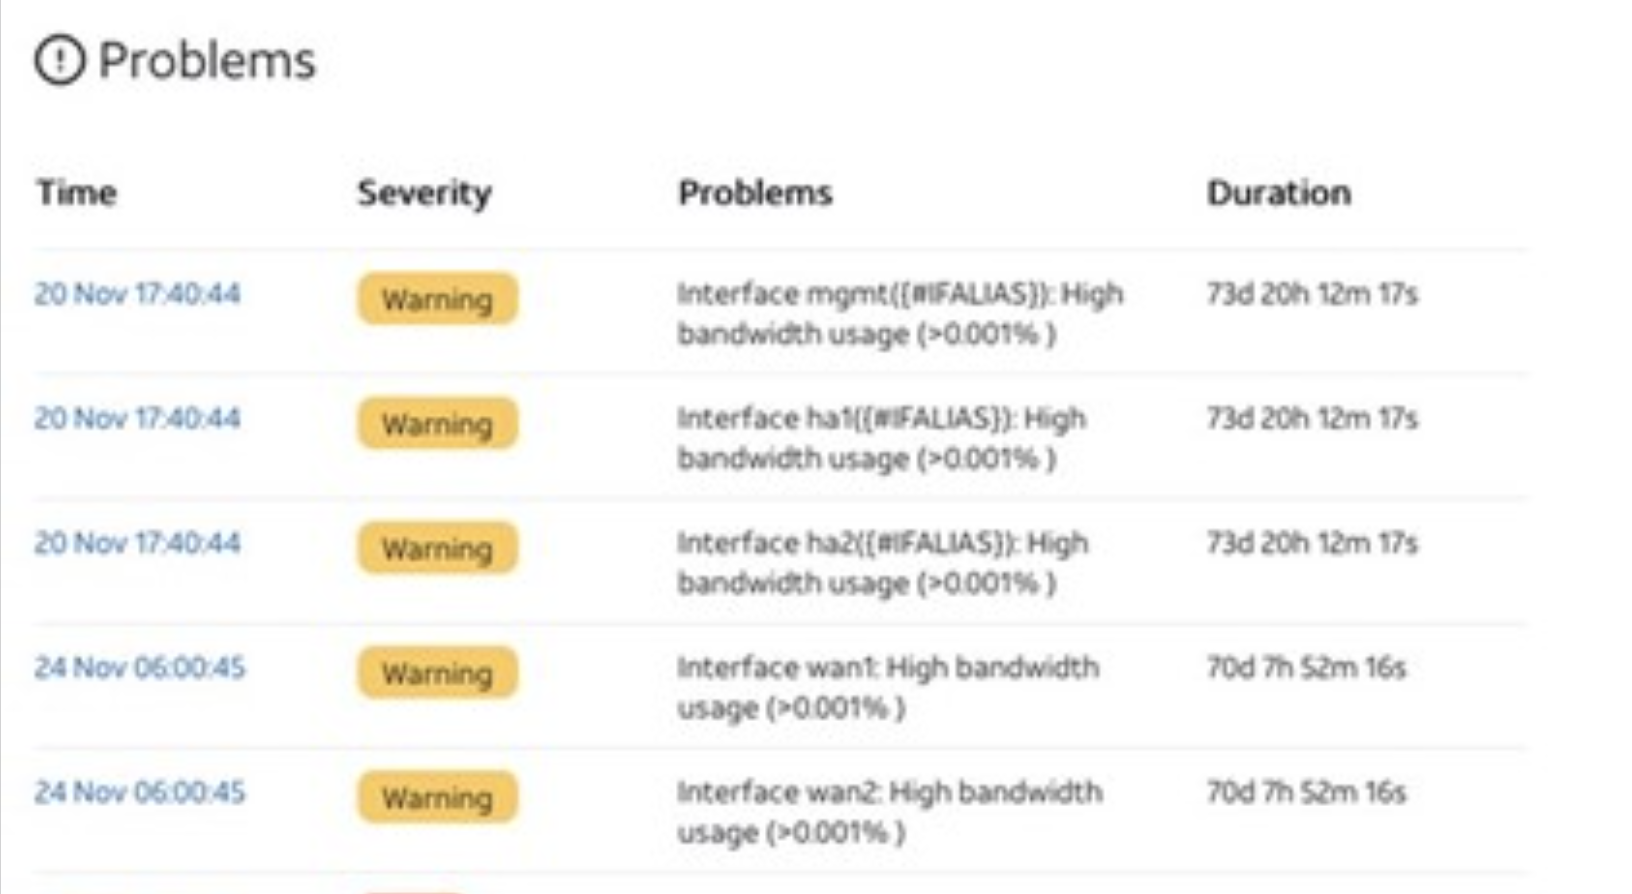
Problems
The Problems section shows a list of the total number of current problems detected by the solution monitoring tools. You can click the entry link to view more details about the problem, including the time it occurred, severity, details of the issue, and duration of the problem.The Duration time will only be updated when the browser window is refreshed.
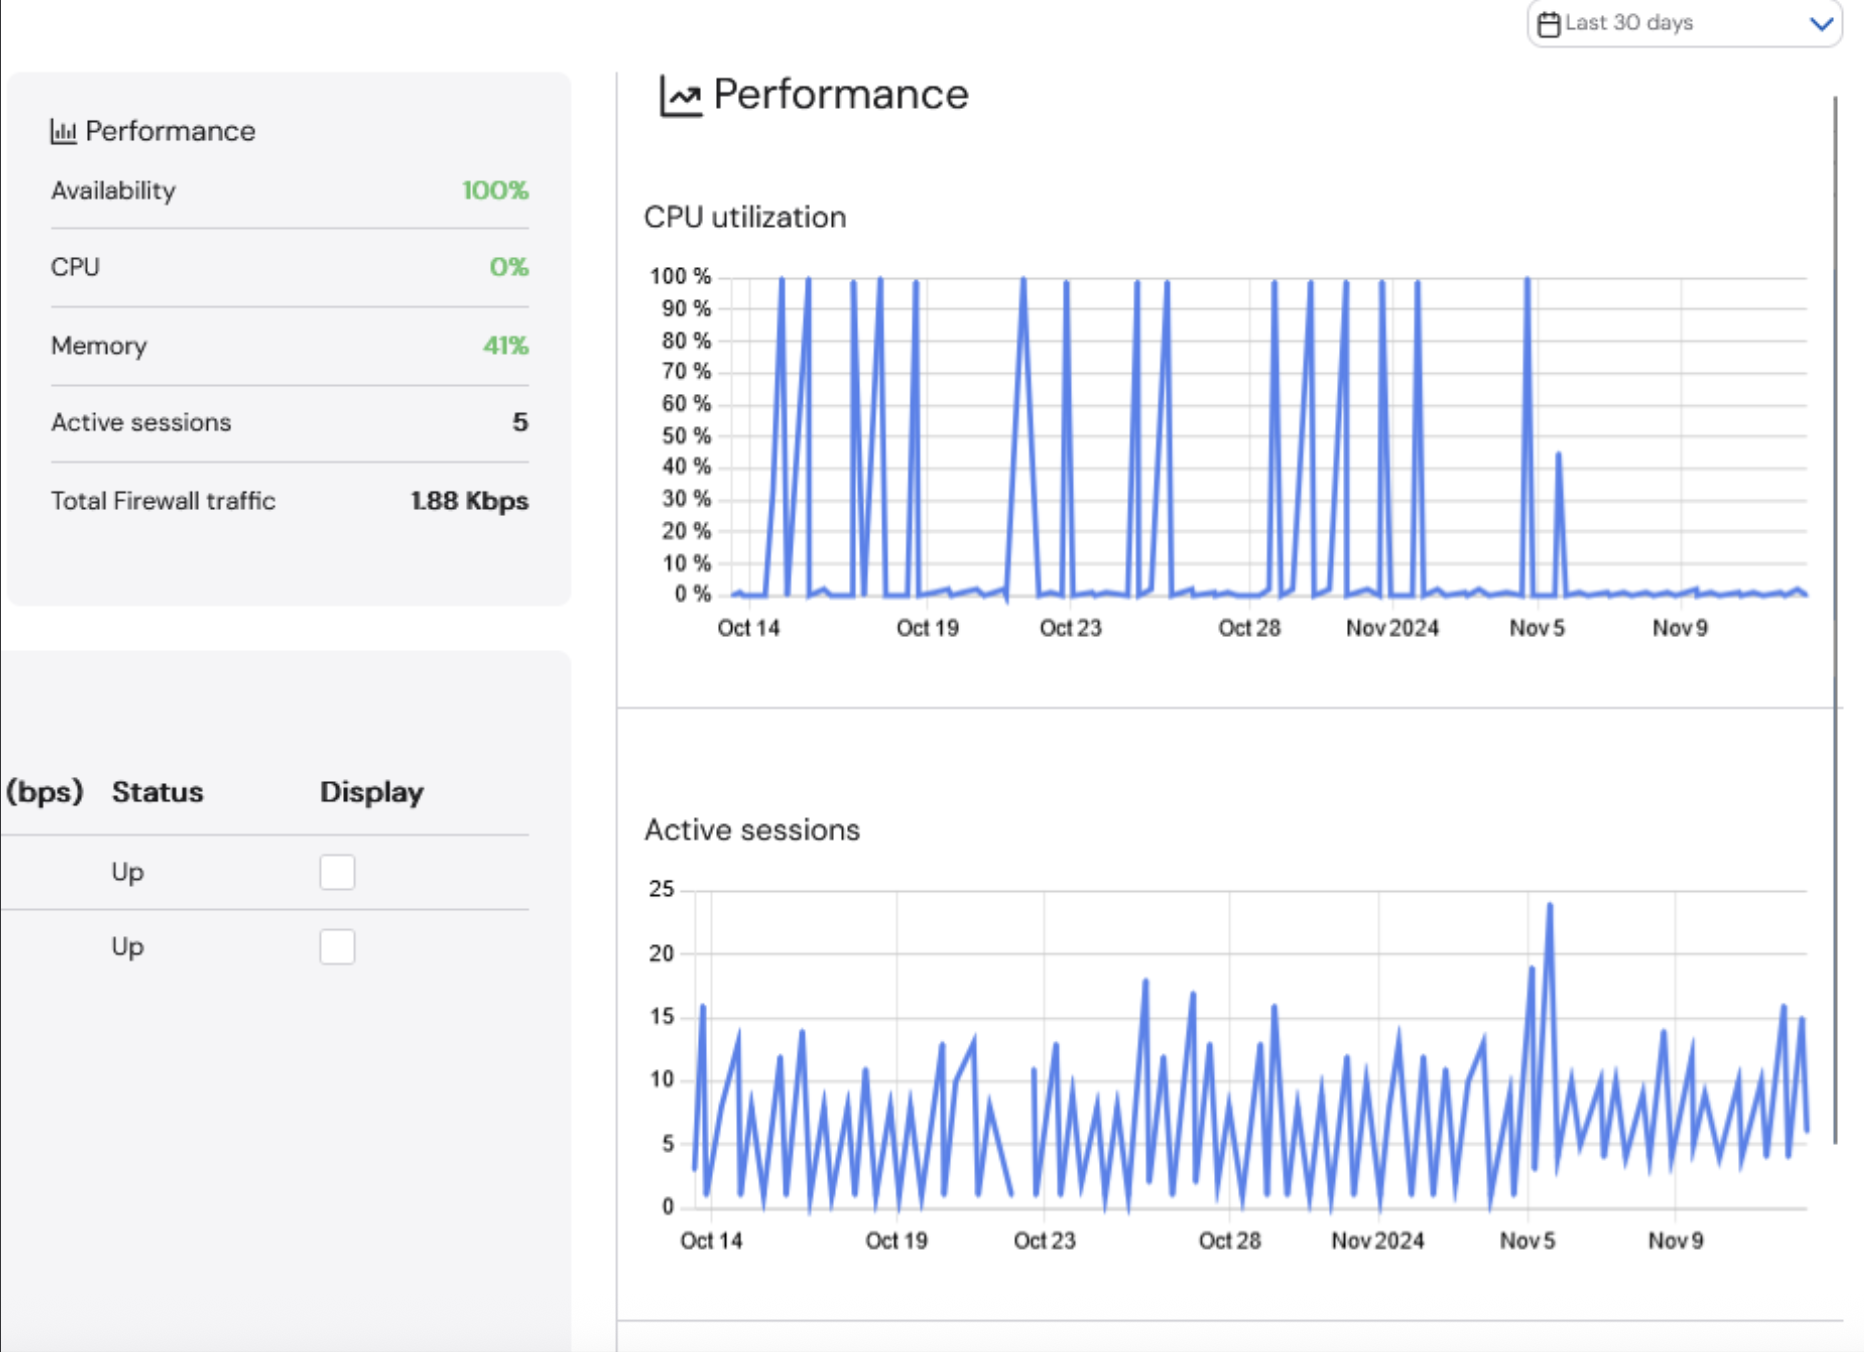
Performance
The Performance section provides information about the performance of the device, including the availability, CPU, memory, number of active sessions, and total firewall traffic. You can click on any of the values to see graphs of the data.CPU utilization is an average of all CPU cores at a given time.
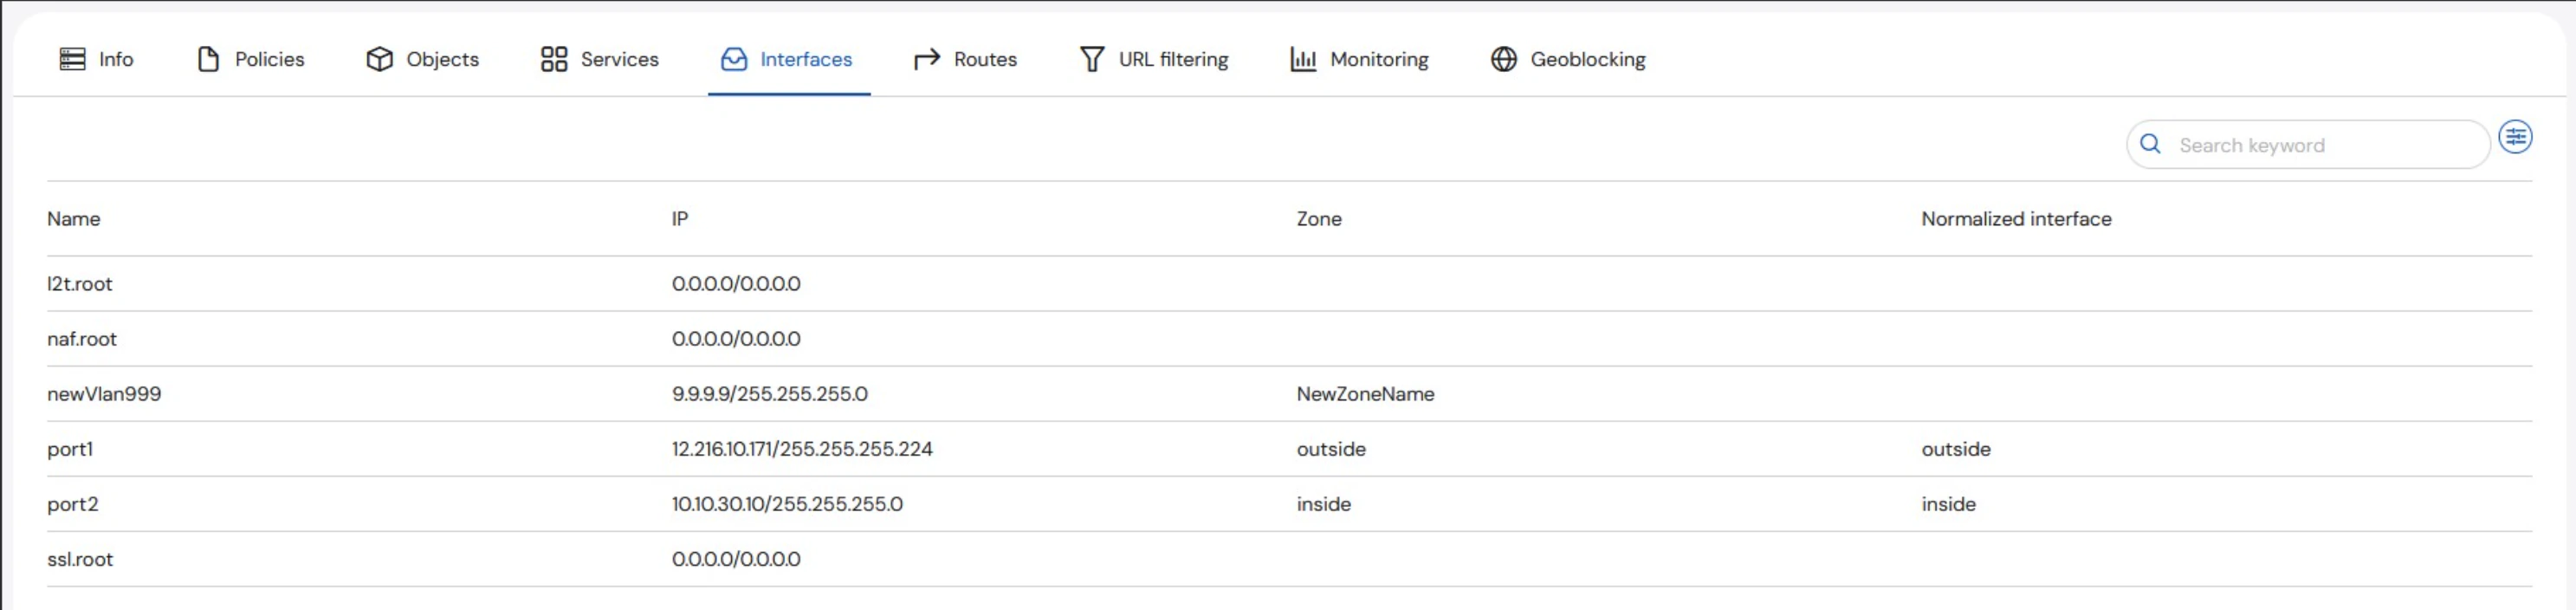
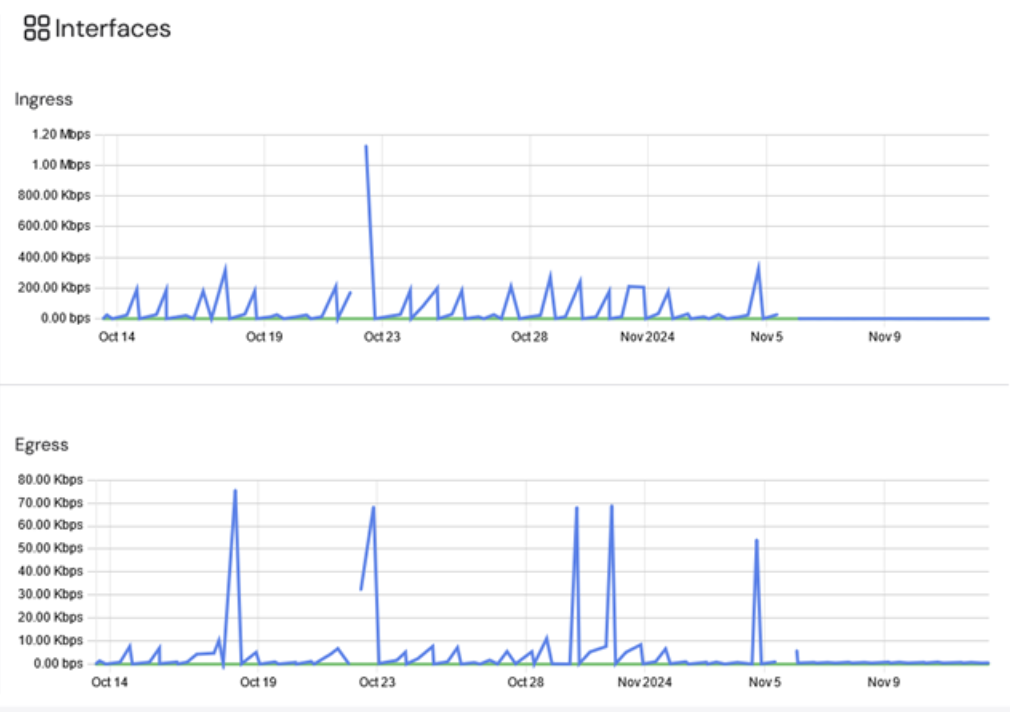
Interfaces
The Interfaces section provides details for the Ingress and Egress for all of the interfaces associated with the selected asset. To display a graph of the traffic, select the checkbox next to the designated interface.