- On the left side of the page are the search and filters options. Use filters to delimit your search.
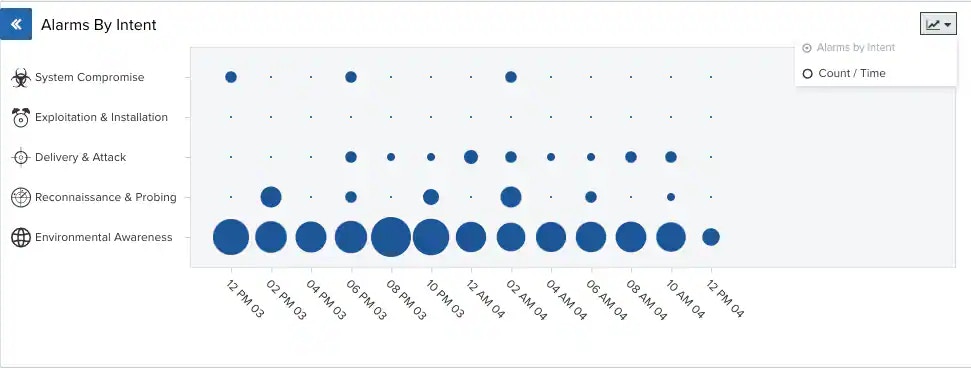
- At the top of the page, you can see any filters you have applied, and you have the option to create and select different views of the alarms.
- The main part of the page is the list of alarms, where each row describes an individual alarm. Click an alarm to open a summary view. See Viewing Alarm Details for more information. Each alarm includes a checkbox that you can use to select it. You can select all alarms in the same page by clicking the checkbox in the first column of the header row. You can also select all the alarms in the system. See Selecting Alarms in Alarm List View for more information.
Refreshing the page
USM Central gives you the option of refreshing the page automatically in a period of time that you can configure. Following the name of the view, you can click the- At the bottom of the expanded pane of the USM Central web user interface (UI), hover over the profile settings options, and select Profile.
-
Click the Alarms Auto Refresh field and select Every 15 Minutes, Every 30 Minutes, Every Hour, or Every 2 Hours. Select is Disabled if you don’t want the alarms to automatically refresh.

- Click Save.
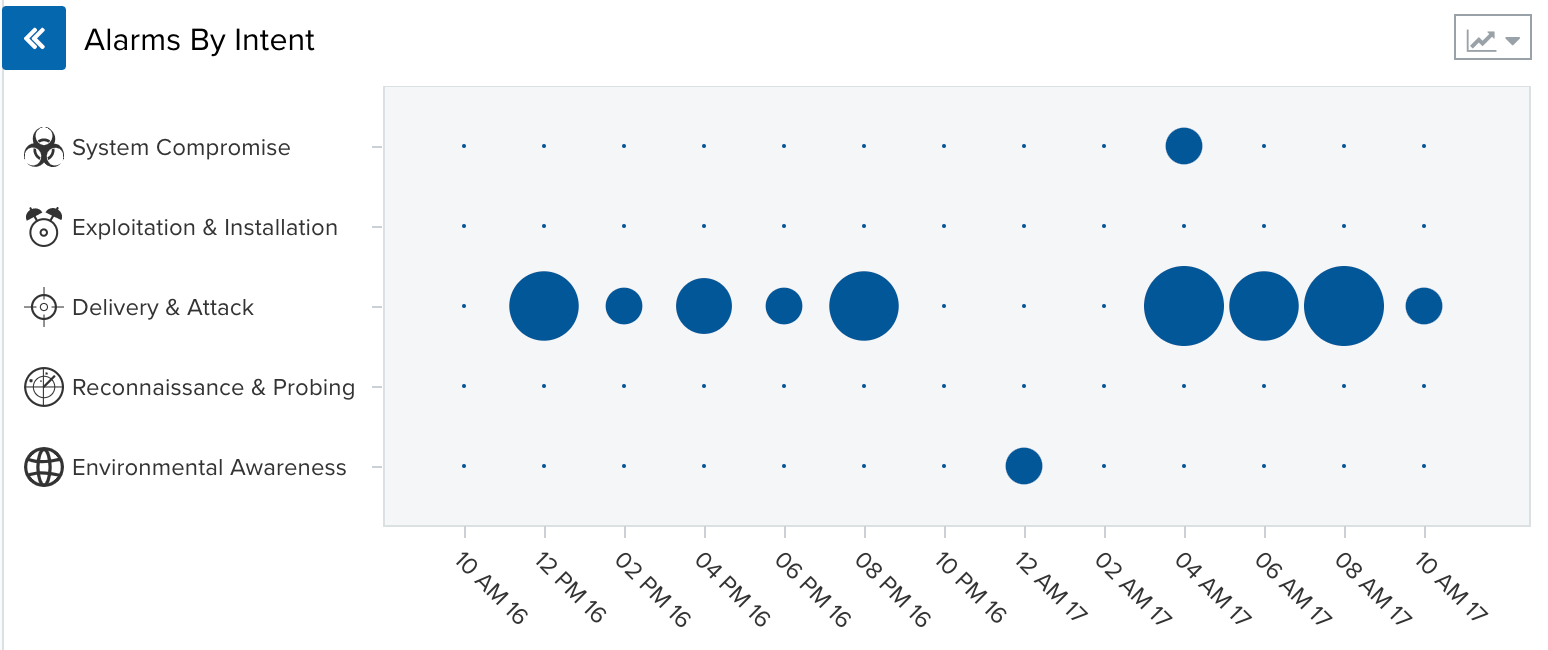
Alarm by Intent Graph
The Alarms by Intent graph in the middle of the page provides a graphical representation of alarms by intent. The blue circles indicate the number of times that an alarm in an intent occurred. A bigger circle indicates a higher number of alarms. You can hover over each of the circles to get the actual number of alarms per intent. In addition, clicking a blue circle displays a list of only the alarms corresponding to that circle. You can change the displayed period of time by clicking the Last 24 Hours filter. Alarms graphed by intent are sorted into five different categories, which are represented by the graphic icons in the display:- Delivery & Attack (
 )
) - Environmental Awareness (
 )
) - Exploitation & Installation (
 )
) - Reconnaissance & Probing (
 )
) - (
 )
)